
For Immediate Release |
The Inventor of MR Scanning™ |
An ISO 9001 Company |
|
| Contact: Daniel Culver | 110 Marcus Drive |
| Director of Communications | Melville, NY 11747-4292 |
| Web site: www.fonar.com | Phone: (631) 694-2929 |
| Email: investor @ fonar. com | Fax: (631) 390-1709 |
MELVILLE, NEW YORK, November 14, 2023 - FONAR Corporation (NASDAQ-FONR), The Inventor of MR Scanning™, reported today its financial results for the first quarter of fiscal 2024 which ended September 30, 2023. FONAR’s primary source of income is attributable to its wholly-owned diagnostic imaging management subsidiary, Health Management Company of America (HMCA). In 2009, HMCA managed 9 MRI scanners. Currently, HMCA manages 42 MRI scanners in New York and in Florida.
Financial Results
Total revenues - Net increased by 11% to $25.8 million for the 1st fiscal quarter ended September 30, 2023, as compared to $23.2 million for the 1st fiscal quarter ended September 30, 2022.
Revenues from the management of diagnostic imaging center segment, consisting of patient fee revenue, net of contractual allowances and discounts, and management and other fees of related and non-related medical practices, increased by 12% to $23.8 million for the 1st fiscal quarter ended September 30, 2023, as compared to $21.3 million for the fiscal quarter ended September 30, 2022.
Revenues from product sales and upgrades and service and repair fees for related and non-related medical parties, for the quarter ended September 30, 2023 was $2.1 million, as compared to $1.9 million for the quarter ended September 30, 2022.
Selling, general and administrative (S, G & A) expenses decreased 23% to $4.9 million in the first three months of fiscal 2024 from $6.3 million in the first three months of fiscal 2023. This decrease in selling, general and administrative expenses was due mainly to less reserves taken on management fees. Some of these reserves had been taken in the ordinary course of business and some in connection with the impact of the COVID-19 virus.
Total Costs and Expenses were approximately the same at $19.3 million for the 1st fiscal quarters ended September 30, 2023, and September 30, 2022. Decreases in S,G & A were offset by increases in costs in the management of diagnostic imaging center segment.
Income from Operations increased 68% to $6.6 million for the quarter ended September 30, 2023, as compared to $3.9 million for the quarter ended September 30, 2022.
Net Income increased 102% to $5.4 million for the quarter ended September 30, 2023, as compared to $2.7 million for the quarter ended September 30, 2022.
Diluted Net Income per Common Share available to common shareholders increased 103% to $0.59, for the quarter ended September 30, 2023, as compared to $0.29 for the quarter ended September 30, 2022.
The weighted average diluted shares outstanding attributable to common stockholders for the quarter ended September quarter ended September and was 6.5 million versus 6.7 million for the quarter ended September, 2022.
Balance Sheet Items
Total Cash and Cash Equivalents and Short Term Investments at September 30, 2023 increased 1% to $51.7 million as compared to the $51.3 million at June 30, 2023.
Total Assets at September 30, 2023 were $201.6 million as compared to $200.6 million at June 30, 2023.
Total Liabilities at September 30, 2023 were $47.5 million as compared to $49.8 million at June 30, 2023.
Total Current Assets at September 30, 2023 were $129.1 million as compared to $125.7 million at June 30, 2023.
Total Current Liabilities at September 30, 2023 were $14.2 million as compared to $15.6 million at June 30, 2023.
FONAR Stockholders’ Equity was $161.3 million at September 30, 2023, as compared to $157.9 million at June 30, 2023.
The Current Ratio was 9.1 at September 30, 2023The Current Ratio was 9.1 at September 30, 2023.
Working Capital increased 4% to $114.9 million at September 30, 2023, as compared to $110.0 million at June 30, 2023.
The ratio of Total Assets/Total Liabilities increased 7% to 4.24 at September 30, 2023 as compared to 3.9 at September 30, 2022.
Net Book Value per Common Share (Total Stockholder’s Equity divided by Common Shares Outstanding) increased 7% to $23.88 at September 30, 2023 as compared to $22.05 at September 30, 2022.
Cash Flow Item
Net Cash Flow provided by Operating activities decreased 3% to $2.6 million for the quarter ended September 30, 2023 as compared to $2.7 million at September 30, 2022.
Management Discussion
Timothy Damadian, president and CEO of FONAR, said, “I’m pleased to report that the total scan volume at HMCA-managed MRI sites in the first quarter of Fiscal 2024 was a record 50,744, which was 14.1% higher than the scan volume in the corresponding quarter of Fiscal 2023 (44,471).”
“There were two primary reasons for the increase. The first was the opening of a new HMCA- managed site in Casselberry, Florida last March. The second was the full return to regular business hours at all HMCA-managed facilities, thanks to having successfully addressed the MRI technologist staffing shortages caused by the COVID-19 pandemic.”
“I am also pleased to announce that we now employ SwiftMR™, Artificial Intelligence (AI) software, at all HMCA-managed sites. SwiftMR™, an FDA 510(k)-cleared software product of AIRS Medical, Inc., uses AI-powered denoising and sharpening to enhance the quality of MRI images and enable the reduction of scan times by up to 50%. Although we’ve been using it for a relatively short period of time, I can report that reading radiologists and referring physicians are very pleased with it; patients appreciate the shorter exam times; and the HMCA facilities have been able to reduce backlogs and schedule more patients each day.”
“Also, FONAR is now the exclusive distributor of SwiftMR™ to FONAR customers for use on their FONAR MRIs and any other MRI scanners they may own. We are proud to be working with AIRS Medical and look forward to long and mutually beneficial relationship.”
“I would also like to report that pursuant to our September 13, 2022 announcement of a FONAR stock repurchase plan of up to $9 million, the Company has, as of September 30, 2023, repurchased 146,359 shares at a cost of $2,473,215. FONAR is limited by the manner, timing, price, and volume restrictions of its share repurchases as prescribed in the safe harbor provisions of Rule 10b-18.”
Mr. Damadian concluded, “HMCA is now managing 42 MRI scanners, 25 in New York and 17 in Florida, and we’re off to a good start for Fiscal 2024. The damage wreaked by COVID-19, including the severe and long-lasting labor shortages it caused, is finally behind us. Yet through it all, we have maintained positive trends in both revenue and profit. I proudly credit our management team and all our employees. Together we look forward to a very successful Fiscal 2024.”
Significant Events
On September 13, 2022, the Company adopted a common stock repurchase plan. The plan has no expiration date and cannot determine the number of shares which will be repurchased. On September 26, 2022, the Board of Directors approved up to $9 million to be repurchased under the plan. The stock will be purchased on the publicly traded open market at prevailing prices.
For the quarter ended September 30, 2023, the Company purchased 43,211 shares at a cost of $713,758. At September 30, 2023, the Company had purchased 146,359 shares at a cost of $2,473,215. Those shares were returned to the corporate treasury. (See note 10 of the 10-Q for details.)
Company Legacy
FONAR’s history is that of being the first Company in the MRI industry and that its founder, Raymond V. Damadian, M.D., is the inventor of the MRI. To accurately preserve these truths, occasionally various achievements of FONAR and Dr. Damadian will be selected and presented.
On July 15, 1988, the National Medal of Technology was presented by President Ronald Reagan, to Raymond V. Damadian, M.D., which he shared jointly with Dr. Paul Lauterbur, for "their independent contributions in conceiving and developing the application of magnetic resonance technology to medical uses, including whole-body scanning and diagnostic imaging."
The National Medal of Technology and Innovation (NMTI) is the nation’s highest honor for technological achievement, bestowed by the president of the United States on America's leading innovators

![]()
Among Dr. Damadian’s independent contributions in conceiving and developing the application of magnetic resonance technology to medical uses, including whole-body scanning and diagnostic imaging was building the world’s first MRI scanner and performing the world’s first MRI scan. The attached photo shows Dr. Damadian with the world’s 1st MRI scanner that he and his graduate assistants built. Inside the scanner is his graduate student, Lawrence Minkoff, Ph.D., who on July 3, 1977, was the first person scanned by an NMR (MRI) machine.
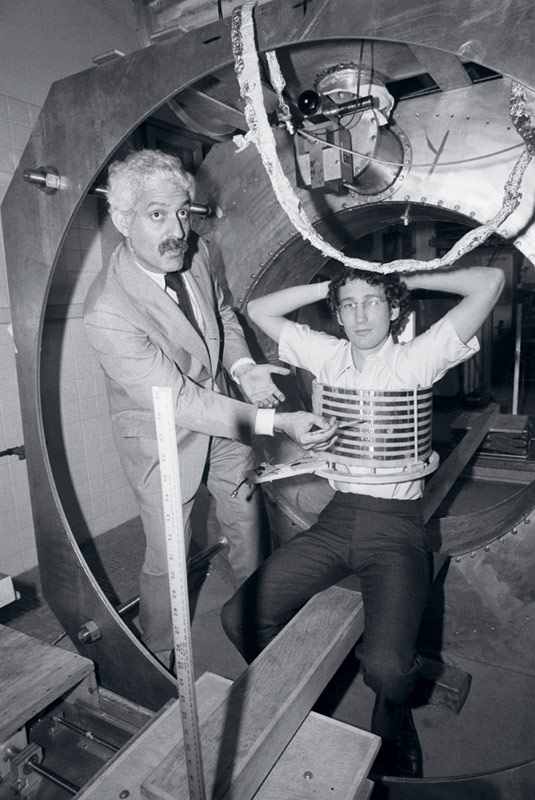
Dr. Raymond Damadian, Lawrence Minkoff, Ph.D. and the World's 1st MRI scanner.
Picture: Courtesy of Fonar Corporation
About FONAR
FONAR, The Inventor of MR Scanning™, located in Melville, NY, was incorporated in 1978, and is the first, oldest and most experienced MRI Company in the industry. FONAR went public in 1981 (Nasdaq:FONR). FONAR sold the world’s first commercial MRI to Ronald J Ross, MD, Cleveland, Ohio. It was installed in 1980. Dr. Ross and his team began the world’s first clinical MRI trials in January 1981. The results were reported in the June 1981 edition of Radiology/Nuclear Medicine Magazine. The technique used for obtaining T1 and T2 values was the FONAR technique (Field fOcusing Nuclear mAgnetic Resonance), not the back projection technique. www.fonar.com/innovations-timeline.html.
FONAR’s signature product is the FONAR UPRIGHT® Multi-Position™
MRI (also known as the STAND-UP® MRI), the only whole-body MRI that
performs Position™ Imaging (pMRI™) and scans patients in numerous
weight-bearing positions, i.e. standing, sitting, in flexion and extension,
as well as the conventional lie-down position. The FONAR UPRIGHT® MRI
often detects patient problems that other MRI scanners cannot because they
are lie-down, “weightless-
only” scanners. The patient-friendly UPRIGHT® MRI has a near-zero
patient claustrophobic rejection rate. As a FONAR customer states, “If
the patient is claustrophobic in this scanner, they’ll be claustrophobic
in my parking lot.” Approximately 85% of patients are scanned sitting
while watching TV.
FONAR has new works-in-progress technology for visualizing and quantifying the cerebral hydraulics of the central nervous system, the flow of cerebrospinal fluid (CSF), which circulates throughout the brain and vertebral column at the rate of 32 quarts per day. This imaging and quantifying of the dynamics of this vital life-sustaining physiology of the body’s neurologic system has been made possible first by FONAR’s introduction of the MRI and now by this latest works-in-progress method for quantifying CSF in all the normal positions of the body, particularly in its upright flow against gravity. Patients with whiplash or other neck injuries are among those who will benefit from this new understanding.
FONAR’s primary source of income and growth is attributable to its wholly-owned diagnostic imaging management subsidiary, Health Management Company of America (HMCA) www.hmca.com.
FONAR’s substantial list of patents includes recent patents for its technology enabling full weight-bearing MRI imaging of all the gravity sensitive regions of the human anatomy, especially the brain, extremities and spine. It includes its newest technology for measuring the Upright cerebral hydraulics of the cerebrospinal fluid (CSF) of the central nervous system. FONAR’s UPRIGHT® Multi-Position™ MRI is the only scanner licensed under these patents.
UPRIGHT®, and STAND-UP® are registered trademarks. The Inventor of MR Scanning™, CSP™, MultiPosition™, UPRIGHT RADIOLOGY™, The Proof is in the Picture™, pMRI™, CFS Videography™, and Dynamic™ are trademarks of Fonar Corporation.
#
This release may include forward-looking statements from the company that may or may not materialize. Additional information on factors that could potentially affect the company's financial results may be found in the company's filings with the Securities and Exchange Commission.
|
FONAR CORPORATION AND SUBSIDIARIES ASSETS |
||
| June 30, | ||
| September 30 |
June 30, |
|
| Current Assets: | ||
| Cash and cash equivalents | $ 51,693 | $ 51,280 |
| Short-term investments | 33 | 33 |
| Accounts receivable - net | 4,092 | 3,861 |
| Accounts receivable - related party | 90 | — |
| Medical receivable - net | 21,924 | 21,259 |
| Management and other fees receivable - net | 38,118 | 35,888 |
| Management and other fees receivable - related medical practices - net | 9,063 | 9,162 |
| Inventories | 2,824 | 2,570 |
| Prepaid expenses and other current assets | 1,310 | 1,608 |
| Total Current Assets | 129,147 | 125,661 |
| Accounts receivable - long term | 500 | 710 |
| Deferred income tax asset | 8,800 | 10,042 |
| Property and equipment - net | 21,107 | 22,146 |
| Right-of-use Asset - operating lease | 33,203 | 33,069 |
| Right-of-use Asset - financing lease | 680 | 729 |
| Goodwill | 4,269 | 4,269 |
| Other intangible assets - net | 3,355 | 3,432 |
| Other assets | 495 | 524 |
| Total Assets | $ 201,556 |
$ 200,582 |
| See accompanying notes to consolidated financial statements. | ||
|
|
||
| September 30, 2023 |
June 30, 2023 |
|
| Current Liabilities: | ||
| Current portion of long-term debt | $ 45 | $ 44 |
| Accounts payable | 1,040 | 1,579 |
| Other current liabilities | 3,984 | 5,444 |
| Unearned revenue on service contracts | 3,944 | 3,832 |
| Unearned revenue on service contracts – related party | 82 | — |
| Operating lease liability - current portion | 4,295 | 3,905 |
| Financing lease liability - current portion | 219 | 218 |
| Customer deposits | 623 | 602 |
| Total Current Liabilities | 14,232 | 15,624 |
| Long-Term Liabilities: | ||
| Unearned revenue on service contracts | 562 | 760 |
| Deferred income tax liability | 395 | 395 |
| Due to related medical practices | 93 | 93 |
| Operating lease liability – net of current portion | 31,503 | 32,105 |
| Financing lease liability – net of current portion | 565 | 620 |
| Long-term debt, less current portion | 104 | 115 |
| Other liabilities | 29 | 42 |
| Total Long-Term Liabilities | 33,251 | 34,130 |
| Total Liabilities | 47,483 | 49,754 |
|
|
||
| September 30, |
June 30, |
|
| Stockholders’ Equity: | ||
| Class A non-voting preferred stock $.0001 par value; 453 shares authorized at September 30, 2023 and June 30, 2023, 313 issued and outstanding at September 30, 2023 and June 30, 2023 | $ — | $ — |
| Preferred stock $.001 par value; 567 shares authorized at September 30, 2023 and June 30, 2023, issued and outstanding – none | — | — |
| Common Stock $.0001 par value; 8,500 shares authorized at September 30, 2023 and June 30, 2023, 6,506 and 6,462 issued at September 30, 2023 and June 30, 2023, respectively 6,451 and 6,451 outstanding at September 30, 2023 and June 30, 2023 respectively | 1 | 1 |
| Class B Common Stock (10 votes per share) $.0001 par value; 227 shares authorized at September 30, 2023 and June 30, 2023; .146 issued and outstanding at September 30, 2023 and June 30, 2023 | — | — |
| Class C Common Stock (25 votes per share) $.0001 par value; 567 shares authorized at September 30, 2023 and June 30, 2023, 383 issued and outstanding at September 30, 2023 and June 30, 2023 | — | — |
| Paid-in capital in excess of par value | 182,613 |
182,613 |
| Accumulated deficit | (20,085 ) |
(24,191 ) |
| Treasury stock, at cost – 55 shares of common stock at September 30, 2023 and 11 shares of common stock at June 30, 2023 | (1,230 ) | (516) |
| Total Fonar Corporation’s Stockholders’ Equity | 161,299 | 157,907 |
| Noncontrolling interests | (7,226 ) | (7,079 ) |
| Total Stockholders' Equity | 154,073 | 150,828 |
| Total Liabilities and Stockholders' Equity | $ 201,556 ================ |
$ 200,582 ================ |
| See accompanying notes to consolidated financial statements. | ||
|
|
||
FOR THE THREE MONTHS ENDED SEPTEMBER 30, |
||
| 2023 | 2022 | |
| REVENUES | ||
| Patient fee revenue – net of contractual allowances and discounts | $ 8,676 | $ 6,076 |
| Product sales – net | 164 | 30 |
| Service and repair fees – net | 1,864 | 1,820 |
| Service and repair fees – related parties – net | 28 | 28 |
| Management and other fees – net | 12,119 | 12,250 |
| Management and other fees – related party medical practices – net | 2,987 | 2,987 |
| Total Revenues – Net | 25,838 | 23,191 |
| COSTS AND EXPENSES | ||
| Costs related to patient fee revenue | 4,427 | 3,800 |
| Costs related to product sales | 103 | 169 |
| Costs related to service and repair fees | 848 | 718 |
| Costs related to service and repair fees – related parties | 13 | 11 |
| Costs related to management and other fees | 7,024 | 6,501 |
| Costs related to management and other fees – related medical practices | 1,519 | 1,398 |
| Research and development | 467 | 349 |
| Selling, general and administrative | 4,866 | 6,334 |
| Total Costs and Expenses | 19,267 | 19,280 |
| Income From Operations | 6,571 | 3,911 |
| Other Income | — | 11 |
| Interest Expense | (48) | (14) |
| Investment Income | 507 | 151 |
| Income Before Provision for Income Taxes and Noncontrolling Interests | 7,030 | 4,059 |
| Provision for Income Taxes | (1,670) | (1,409) |
| Net Income | $ 5,360 | $ 2,650 |
| Net Income – Noncontrolling Interests | (1,254) | (603) |
| Net Income – Attributable to FONAR | $ 4,106 ================ |
$ 2,047 ================ |
| Net Income Available to Common Stockholders | $ 3,855 ================ |
$ 1,923 ================ |
| Net Income Available to Class A Non-Voting Preferred Stockholders | $ 187 ================ |
$ 92 ================ |
| Net Income Available to Class C Common Stockholders | $ 64 ================ |
$ 32 ================ |
| Basic Net Income Per Common Share Available to Common Stockholders | $ 0.60 ================ |
$ 0.29 ================ |
| Diluted Net Income Per Common Share Available to Common Stockholders | $ 0.59 ================ |
$ 0.29 ================ |
| Basic and Diluted Income Per Share – Class C Common | $ 0.17 ================ |
$ 0.08 ================ |
| Weighted Average Basic Shares Outstanding – Common Stockholders | 6,408 ================ |
6,545 ================ |
| Weighted Average Diluted Shares Outstanding - Common Stockholders | 6,536 ================ |
6,673 ================ |
| Weighted Average Basic and Diluted Shares Outstanding – Class C Common | 383 ================ |
383 ================ |
| See accompanying notes to consolidated financial statements. | ||
|
|
||
| FOR THE THREE MONTHS ENDED SEPTEMBER 30, |
||
| Cash Flows from Operating Activities: | 2023 | 2022 |
| Net Income | $ 5,360 | $ 2,650 |
| Adjustments to reconcile net income to net cash provided by operating activities: |
||
| Depreciation and amortization |
1,195 | 1,118 |
| Amortization of right-of-use assets | 1,024 | 1,061 |
| (Recovery) Provision for bad debts | (68) | 1,398 |
| Deferred income tax – net | 1,242 | 1,146 |
| (Increase) decrease in operating assets, net: | ||
| Accounts, medical and management fee receivable(s) | (2,837) | (1,407) |
| Notes receivable | 5 | 11 |
| Inventories | (255) | (98) |
| Prepaid expenses and other current assets | 293 | (14) |
| Other assets | 29 | — |
| Increase (decrease) in operating liabilities, net: | ||
| Accounts payable | (539) | (779) |
| Other current liabilities | (1,463) | (1,580) |
| Operating lease liabilities | (1,322) | (912) |
| Financing lease liabilities | (54) | (52) |
| Customer deposits | 20 | 171 |
| Other liabilities | (12) | (16) |
| Net cash provided by operating activities | 2,618 | 2,697 |
| Cash Flows from Investing Activities: | ||
Purchases of property and equipment |
(63) | (939) |
| Cost of patents | (16) | (24) |
| Net cash used in investing activities | (79) | (963) |
| Cash Flows from Financing Activities: | ||
| Repayment of borrowings and capital lease obligations | (11) | (5) |
| Purchase of treasury stock | (714) | (122) |
| Distributions to noncontrolling interests | (1,401) | (1,634) |
| Net cash used in financing activities | (2,126) | (1,761) |
| Net Increase (Decrease) in Cash and Cash Equivalents | 413 |
(27) |
| Cash and Cash Equivalents - Beginning of Period | 51,280 | 48,723 |
| Cash and Cash Equivalents - End of Period | $ 51,693 ================ |
$ 48,696 ================ |
| |
||
| |
||