
For Immediate Release |
The Inventor of MR Scanning™ |
An ISO 9001 Company |
|
| Contact: Daniel Culver | 110 Marcus Drive |
| Director of Communications | Melville, NY 11747-4292 |
| Web site: www.fonar.com | Phone: (631) 694-2929 |
| Email: investor @ fonar. com | Fax: (631) 390-1709 |
Total MRI scan volume at the HMCA-managed sites increased 13% to 101,990 scans for the six months ending December 31, 2023 versus the corresponding period one year earlier.
Cash and cash equivalents and short-term investments increased 4% to $53.2 million at December 31, 2023, versus the fiscal year ended June 30, 2023.
Total Revenues-Net for the six month period ended December 31, 2023 increased by 8% to $51.2 million, and for the quarter ended December 31, 2023 increased by 5% to $25.4 million, versus corresponding periods one year earlier.
Income from Operations for the six month period ended December 31, 2023 increased 41% to $11.4 million, and for the quarter ended December 31, 2023 increased 15% to $4.9 million, versus the corresponding periods one year earlier.
Net Income for the six months ended December 31, 2023 increased 83% to $10.0 million, and for the quarter ended December 31, 2023 increased 64% to $4.6 million, versus corresponding periods one year earlier.
Diluted Net Income per Common Share for the six month period ended December 31, 2023 increased 87% to $1.12 and for the quarter ended December 31, 2023 increased 69% to $0.54, versus the corresponding periods one year earlier.
Net Book Value Per Common Share increased to $24.70 per share at December 31, 2023.
MELVILLE, NEW YORK, February 14, 2024 - FONAR Corporation (NASDAQ-FONR), The Inventor of MR Scanning™, reported today its financial results for the six month period and 2nd quarter of fiscal 2024 which ended December 31, 2023. FONAR’s primary source of income is attributable to its wholly-owned diagnostic imaging management subsidiary, Health Management Company of America (HMCA). In 2009, HMCA managed 9 MRI scanners. Currently, HMCA manages 42 MRI scanners in New York (25) and in Florida (17).
Financial Results
Total Revenues-Net for the quarter ended December 31, 2023 increased 5% to $25.4 million, as compared to $24.3 million for the corresponding quarter ended December 31, 2022. Total Revenues-Net for the six months ended December 31, 2023 increased 8% to $51.2 million, as compared to $47.4 million for the corresponding six month period ended December 31, 2022.
Income from Operations for the quarter ended December 31, 2023 increased 15% to $4.9 million as compared to $4.2 million for the corresponding quarter ended December 31, 2022. Income from Operations for the six months ended December 31, 2023 increased 41% to $11.4 million as compared to $8.1 million for the corresponding six month period ended December 31, 2022.
Net Income for the quarter ended December 31, 2023 increased 64% to $4.6 million as compared to $2.8 million for the corresponding quarter ended December 31, 2022. Net Income for the six months ended December 31, 2023 increased 83% to $10.0 million as compared to $5.5 million for the corresponding six month period ended December 31, 2022.
Diluted Net Income per Common Share Available to Common Stockholders for the quarter ended December 31, 2023 increased 69% to $0.54 as compared to $0.32 for the corresponding quarter ended December 31, 2022.
Diluted Net Income per Common Share Available to Common Stockholders for the six months ended December 31, 2023 increased 87% to $1.12 as compared to $0.60 for the corresponding six month period ended December 31, 2022.
Selling, general & administrative expenses (SG&A) for the quarter ended December 31, 2023 decreased 15% to $5.6 million, as compared to $6.6 million for the corresponding quarter ended December 31, 2022. SG&A for the six months ended December 31, 2023 decreased 19% to $10.5 million as compared to $12.9 million for the corresponding six months ended December 31, 2022.
Cash Flow Statement Item
Operating Cash Flow for the six-month period ended December 31, 2023 increased 14% to $6.7 million, compared to $5.9 million for the six-month period ended December 31, 2022.
Balance Sheet Items
Cash and cash equivalents and short term investments were $53.3 million at December 31, 2023 as compared to $51.3 million at June 30, 2023.
Total Current Assets at December 31, 2023 were $132.5 million as compared to $125.7 million at June 30, 2023.
Total Assets were $202.3 million at December 31, 2023 as compared to $200.6 million at June 30, 2023.
Total Current Liabilities were $14.2 million at December 31, 2023 as compared to $15.6 million at June 30, 2023.
Total Liabilities at December 31, 2023 were $46.0 million, as compared to $49.8 million at June 30, 2023.
Total Stockholders’ Equity at December 31, 2023 was $156.3 million, as compared to $150.8 million at June 30, 2023.
Financial Ratios
The ratio of Total Assets / Total Liabilities at December 31, 2023 was 4.4 as compared to 4.0 at June 30, 2023.
Working Capital increased 8% to $118.4 million at December 31, 2023 as compared to $110.0 million at June 30, 2023.
Net Book Value Per Common Share increased to $24.70 per share at December 31, 2023’
Net Cash Flow provided by Operating activities decreased 3% to $2.6 million for the quarter ended September 30, 2023 as compared to $2.7 million at September 30, 2022.
Management Discussion
Timothy Damadian, president and CEO of FONAR, said, “I’m pleased to report that the total scan volume at HMCA-managed MRI centers in the second quarter of Fiscal 2024 was a record 51,246, which was 12.8% higher than the scan volume in the corresponding quarter of Fiscal 2023 (45,412). Further, the scan volume in the first six months of Fiscal 2024 was a record 101,990, which was 13.5% higher than the scan volume in the corresponding six months of Fiscal 2023 (89,888).”
“A primary reason for the growth was the opening of the new center in Casselberry, Florida last March. In addition, an HMCA-managed Stand-Up MRI will soon open in the Bronx. There already is a long-standing and very busy Stand-Up MRI center on the east side of the Bronx and the next will be in the south. Between these two Bronx centers, access to the very popular Stand-Up® MRI technology will be substantially broadened for the entire borough.”
“Another reason for the growth in scan volume has been the return to regular business hours at all of the HMCA-managed facilities. Prolonged periods of reduced business hours were the result of COVID-related staffing shortages, particularly among MRI technologists. Competing for competent employees from an industry-wide, shrinking labor pool has not been easy. Thankfully, we have largely solved the problem through an intense and innovative recruiting campaign.”
“I would also like to report that pursuant to our September 13, 2022 announcement of a FONAR stock repurchase plan of up to $9 million, the Company has, as of December 31, 2023, repurchased 218,656 shares at a cost of $3,644,101. FONAR is limited by the manner, timing, price, and volume restrictions of its share repurchases as prescribed in the safe harbor provisions of Rule 10b-18.”
Mr. Damadian concluded, “I’m pleased with our current rate of growth. In the past, we have added MRI scanners to facilities when the demand for MRIs was approaching their scanning capacities, or where the introduction of high-field MRI technology significantly expanded the referring physician base. It’s been a very successful strategy, and so we will continue to pursue it. As always, we also seek to establish new locations or to acquire existing centers that will enhance our existing networks and increase their profitability. Currently, we manage 42 MRI scanners, 25 in New York and 17 in Florida. Fiscal 2024 looks very promising, and so I remain grateful for our management team and all of our employees.”
Significant Event
Opening of the Raymond V. Damadian, M.D. Memorial Museum
On December 20, 2023, FONAR opened the Raymond V. Damadian, M.D. Memorial Museum at its corporate headquarters in Melville, New York. Adjacent to the front lobby, the museum includes a recreation of the making of the world’s first MRI image on the world’s first MRI scanner, Indomitable, at the Downstate Medical Center in Brooklyn, New York on July 2 and 3, 1977.
The display includes an exact replica of Indomitable along with life-size figures of the three inventors: Dr. Raymond V. Damadian and his two postgraduate students, Lawrence Minkoff and Michael Goldsmith.
The walls of the museum are lined with panels of captioned pictures, documents, and publications covering Dr. Damadian’s personal and family history; his discovery that made and continues to make MRI possible; the building of Indomitable; the making of the first MRI image; the formation and history of FONAR; and Dr. Damadian’s achievements, honors, awards, victories, disappointments and his expression of gratitude to God.
The museum also includes an interactive display, some of Dr. Damadian’s personal items, and many historical artifacts. The opening was attended by corporate employees and family members, and is now open to the public by appointment. To make an appointment, contact Daniel Culver, Director of Communications, at RVDmuseum@fonar.com.
FONAR Legacy
The World’s First Clinical Trials for MRI Were Conducted on a FONAR Scanner
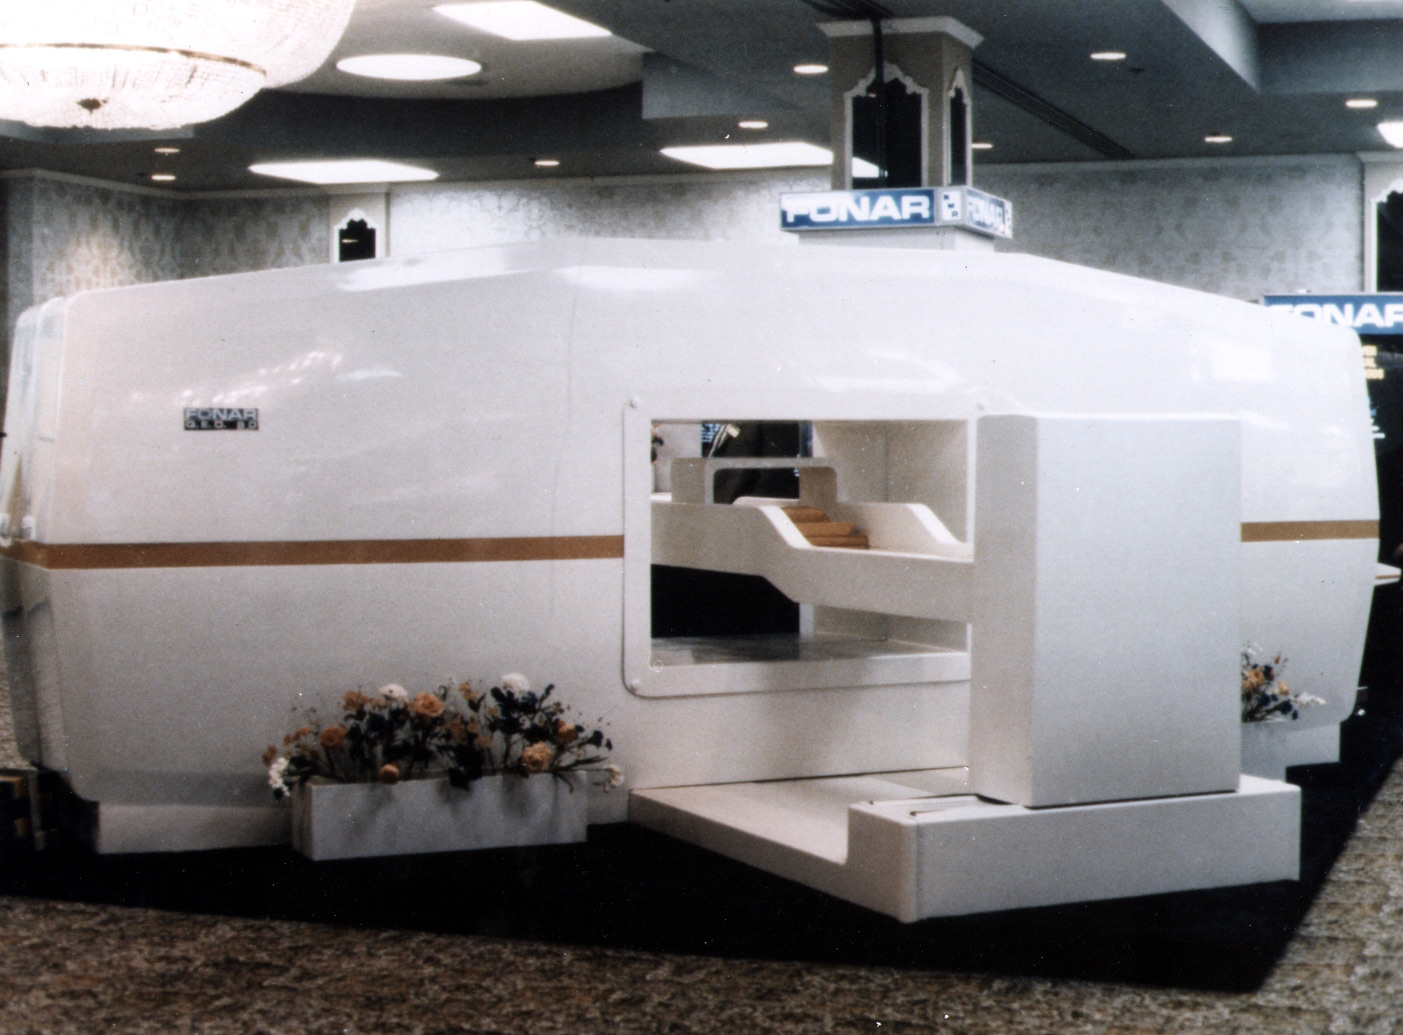
FONAR Corporation, founded in July, 1978, was the world’s first MRI company. It introduced the world’s first commercial MRI in 1980, the FONAR QED 80, the first of which was installed at the radiology practice of Ross, Lie, Thompson & Associates, in Mayfield Heights, Ohio later in the same year. Dr. Damadian and Dr. Ronald J. Ross, M.D., the senior member of the practice, were members of the Class of 1960 at the Albert Einstein College of Medicine in Bronx, New York.
It was there at Dr. Ross’ practice where the first clinical trials on an MRI scanner were conducted. The event was covered in the June 1981 issue of Radiology/Nuclear Medicine Magazine (1). The headline on the front cover, “NMR Clinical Trials Begin,” was accompanied by an image of the thorax produced by the QED 80, a corresponding CT image, and the diagnosis based on the two studies. [Note: The descriptor “MRI” has since replaced “NMR,” an abbreviation for Nuclear Magnetic Resonance.]
In November 1981, Dr. Ross and colleagues presented their findings at the annual meeting of the Radiological Society of North America (RSNA), the world’s largest medical meeting in the field of radiology (2). Their results were subsequently published in the peer-reviewed journal, Radiology (3), in April 1982.
Bibliography:
(1)
https://www.fonar.com/pdf/Radiology-nuclear-medicine-magazine.pdf
(2) Presented at the Sixty-Seventh Scientific Assembly and Annual Meeting
of the Radiological Society of North America (RSNA), Chicago, Il, Nov. 15-20,
1981.
(3) R. J. Ross, M.D., J. Thompson, M.D., K. Kim, M.D., and R. A. Bailey,
M.D., Radiology 143: 195-205, April 1982, “Nuclear Magnetic Resonance
Imaging and Evaluation of Human Breast Tissue: Preliminary Clinical Trials.”
https://pubs.rsna.org/doi/10.1148/radiology.143.1.7063727
About FONAR
FONAR, The Inventor of MR Scanning™, located in Melville, NY, was incorporated in 1978, and is the first, oldest and most experienced MRI Company in the industry. FONAR went public in 1981 (Nasdaq:FONR). FONAR sold the world’s first commercial MRI to Ronald J Ross, MD, Cleveland, Ohio. It was installed in 1980. Dr. Ross and his team began the world’s first clinical MRI trials in January 1981. The results were reported in the June 1981 edition of Radiology/Nuclear Medicine Magazine and the April 1982 peer-reviewed article in the Journal Radiology. The technique used for obtaining T1 and T2 values was the FONAR technique (Field fOcusing Nuclear mAgnetic Resonance), not the back projection technique. www.fonar.com/innovations-timeline.html.
FONAR’s signature product is the FONAR UPRIGHT® Multi-Position™ MRI (also known as the STAND-UP® MRI), the only whole-body MRI that performs Position™ Imaging (pMRI™) and scans patients in numerous weight-bearing positions, i.e. standing, sitting, in flexion and extension, as well as the conventional lie-down position. The FONAR UPRIGHT® MRI often detects patient problems that other MRI scanners cannot because they are lie-down, “weightless-only” scanners. The patient-friendly UPRIGHT® MRI has a near-zero patient claustrophobic rejection rate. As a FONAR customer states, “If the patient is claustrophobic in this scanner, they’ll be claustrophobic in my parking lot.” Approximately 85% of patients are scanned sitting while watching TV.
FONAR has new works-in-progress technology for visualizing and quantifying the cerebral hydraulics of the central nervous system, the flow of cerebrospinal fluid (CSF), which circulates throughout the brain and vertebral column at the rate of 32 quarts per day. This imaging and quantifying of the dynamics of this vital life-sustaining physiology of the body’s neurologic system has been made possible first by FONAR’s introduction of the MRI and now by this latest works-in-progress method for quantifying CSF in all the normal positions of the body, particularly in its upright flow against gravity. Patients with whiplash or other neck injuries are among those who will benefit from this new understanding.
FONAR’s primary source of income and growth is attributable to its wholly-owned diagnostic imaging management subsidiary, Health Management Company of America (HMCA) www.hmca.com.
FONAR’s substantial list of patents includes recent patents for its technology enabling full weight-bearing MRI imaging of all the gravity sensitive regions of the human anatomy, especially the brain, extremities and spine. It includes its newest technology for measuring the Upright cerebral hydraulics of the cerebrospinal fluid (CSF) of the central nervous system. FONAR’s UPRIGHT® Multi-Position™ MRI is the only scanner licensed under these patents.
UPRIGHT®, and STAND-UP® are registered trademarks. The Inventor of MR Scanning™, CSP™, MultiPosition™, UPRIGHT RADIOLOGY™, pMRI™, CFS Videography™, Dynamic™ and The Proof is in the Picture™, are trademarks of Fonar Corporation.
#
This release may include forward-looking statements from the company that may or may not materialize. Additional information on factors that could potentially affect the company's financial results may be found in the company's filings with the Securities and Exchange Commission.
|
FONAR CORPORATION AND SUBSIDIARIES ASSETS |
||
| December 31 |
June 30, |
|
| Current Assets: | ||
| Cash and cash equivalents | $ 53,225 | $ 51,280 |
| Short-term investments | 33 | 33 |
| Accounts receivable - net | 3,881 | 3,861 |
| Accounts receivable - related party | 60 | — |
| Medical receivable - net | 22,548 | 21,259 |
| Management and other fees receivable - net | 39,352 | 35,888 |
| Management and other fees receivable - related medical practices - net | 9,267 | 9,162 |
| Inventories | 2,835 | 2,570 |
| Prepaid expenses and other current assets | 1,341 | 1,608 |
| Total Current Assets | 132,542 | 125,661 |
| Accounts receivable - long term | 376 | 710 |
| Note receivable – related party | 577 | — |
| Deferred income tax asset | 7,758 | 10,042 |
| Property and equipment - net | 20,109 | 22,146 |
| Right-of-use Asset - operating lease | 32,234 | 33,069 |
| Right-of-use Asset - financing lease | 630 | 729 |
| Goodwill | 4,269 | 4,269 |
| Other intangible assets - net | 3,266 | 3,432 |
| Other assets | 501 | 524 |
| Total Assets | $ 202,262 |
$ 200,582 |
|
|
||
| December 31, 2023 |
June 30, 2023 |
|
| Current Liabilities: | ||
| Current portion of long-term debt | $ 45 | $ 44 |
| Accounts payable | 1,335 | 1,579 |
| Other current liabilities | 3,460 | 5,444 |
| Unearned revenue on service contracts | 3,804 | 3,832 |
| Unearned revenue on service contracts – related party | 55 | — |
| Operating lease liability - current portion | 4,658 | 3,905 |
| Financing lease liability - current portion | 222 | 218 |
| Customer deposits | 600 | 602 |
| Total Current Liabilities | 14,179 | 15,624 |
| Long-Term Liabilities: | ||
| Unearned revenue on service contracts | 376 | 760 |
| Deferred income tax liability | 395 | 395 |
| Due to related medical practices | 93 | 93 |
| Operating lease liability – net of current portion | 30,299 | 32,105 |
| Financing lease liability – net of current portion | 508 | 620 |
| Long-term debt, less current portion | 92 | 115 |
| Other liabilities | 23 | 42 |
| Total Long-Term Liabilities | 31,786 | 34,130 |
| Total Liabilities | 45,965 | 49,754 |
|
|
||
| December 31, |
June 30, |
|
| STOCKHOLDERS’ EQUITY: | ||
| Class A non-voting preferred stock $.0001 par value; 453 shares authorized at December 31, 2023 and June 30, 2023, 313 issued and outstanding at December 31, 2023 and June 30, 2023 | $ — | $ — |
| Preferred stock $.001 par value; 567 shares authorized at December 31, 2023 and June 30, 2023, issued and outstanding – none | — | — |
| Common Stock $.0001 par value; 8,500 shares authorized at December 31, 2023 and June 30, 2023, 6,332 and 6,462 issued at December 31, 2023 and June 30, 2023, respectively 6,328 and 6,451 outstanding at December 31, 2023 and June 30, 2023 respectively | 1 | 1 |
| Class B Common Stock (10 votes per share) $.0001 par value; 227 shares authorized at December 31, 2023 and June 30, 2023; .146 issued and outstanding at December 31, 2023 and June 30, 2023 | — | — |
| Class C Common Stock (25 votes per share) $.0001 par value; 567 shares authorized at December 31, 2023 and June 30, 2023, 383 issued and outstanding at December 31, 2023 and June 30, 2023 | — | — |
| Paid-in capital in excess of par value | 180,607 |
182,613 |
| Accumulated deficit | (16,326 ) |
(24,191) |
| Treasury stock, at cost - 4 shares of common stock at December 31, 2023 and 11 shares of common stock at June 30, 2023 | (395) | (516) |
| Total Fonar Corporation’s Stockholders’ Equity | 163,887 | 157,907 |
| Non controlling interests | (7,590 ) | (7,079) |
| Total Stockholders' Equity | 156,297 | 150,828 |
| Total Liabilities and Stockholders' Equity | $ 202,262 ================ |
$ 200,582 ================ |
| See accompanying notes to consolidated financial statements. | ||
|
|
||
FOR THE THREE MONTHS ENDED DECEMBER 31, |
||
| 2023 | 2022 | |
| REVENUES | ||
| Patient fee revenue – net of contractual allowances and discounts | $ 8,221 | $ 7,129 |
| Product sales – net | 55 | 170 |
| Service and repair fees – net | 1,778 | 1,838 |
| Service and repair fees – related parties – net | 28 | 28 |
| Management and other fees – net | 12,316 | 12,092 |
| Management and other fees – related party medical practices – net | 2,988 | 2,999 |
| Total Revenues – Net | 25,386 | 24,256 |
| COSTS AND EXPENSES | ||
| Costs related to patient fee revenue | 4,602 | 4,023 |
| Costs related to product sales | 302 | 214 |
| Costs related to service and repair fees | 784 | 722 |
| Costs related to service and repair fees – related parties | 12 | 11 |
| Costs related to management and other fees | 7,208 | 6,622 |
| Costs related to management and other fees – related medical practices | 1,590 | 1,492 |
| Research and development | 416 | 342 |
| Selling, general and administrative | 5,587 | 6,598 |
| Total Costs and Expenses | 20,501 | 20,024 |
| Income From Operations | 4,885 | 4,232 |
| Other Expense | — | (208 ) |
| Other Income – Related party | 577 | — |
| Interest Expense | (10) | (12) |
| Investment Income | 534 | 263 |
| Income Before Provision for Income Taxes and Noncontrolling Interests | 5,986 | 4,275 |
| Provision for Income Taxes | (1,366) | (1,463) |
| Net Income | 4,620 | 2,812 |
| Net Income – Noncontrolling Interests | (861) | (580) |
| Net Income – Attributable to FONAR | $ 3,759 ================ |
$ 2,232 ================ |
| Net Income Available to Common Stockholders | $ 3,525 ================ |
$ 2,097 ================ |
| Net Income Available to Class A Non-Voting Preferred Stockholders | $ 175 ================ |
$ 101 ================ |
| Net Income Available to Class C Common Stockholders | $ 59 ================ |
$ 34 ================ |
| Basic Net Income Per Common Share Available to Common Stockholders | $ 0.55 ================ |
$ 0.32 ================ |
| Diluted Net Income Per Common Share Available to Common Stockholders | $ 0.54 ================ |
$ 0.32 ================ |
| Basic and Diluted Income Per Share – Class C Common | $ 0.16 ================ |
$ 0.09 ================ |
| Weighted Average Basic Shares Outstanding – Common Stockholders | 6,437 ================ |
6,527 ================ |
| Weighted Average Diluted Shares Outstanding - Common Stockholders | 6,565 ================ |
6,655 ================ |
| Weighted Average Basic and Diluted Shares Outstanding – Class C Common | 383 ================ |
383 ================ |
| See accompanying notes to consolidated financial statements. | ||
|
|
||
| FOR THE SIX MONTHS ENDED DECEMBER 31, |
||
| REVENUES | 2023 | 2022 |
| Patient fee revenue – net of contractual allowances and discounts | $ 16,896 | $ 13,205 |
| Product sales – net |
219 | 200 |
| Service and repair fees – net |
3,643 | 3,658 |
| Service and repair fees - related parties – net | 55 | 55 |
| Management and other fees – net | 24,436 | 24,342 |
| Management and other fees - related medical practices – net | 5,975 | 5,987 |
| Total Revenues – Net | 51,224 | 47,447 |
| COSTS AND EXPENSES | ||
| Costs related to patient fee revenue | 9,029 | 7,822 |
| Costs related to product sales | 405 | 383 |
| Costs related to service and repair fees | 1,633 | 1,440 |
| Costs related to service and repair fees - related parties | 25 | 22 |
| Costs related to management and other fees | 14,231 | 13,124 |
| Costs related to management and other fees – related medical practices | 3,109 | 2,890 |
| Research and development | 883 | 691 |
| Selling, general and administrative | 10,453 | 12,932 |
| Total Costs and Expenses | 39,768 | 39,304 |
| Income From Operations | 11,456 | 8,143 |
| Other Income (Expense) | 1 | (197) |
| Other Income – Related party | 577 | — |
| Interest Expense | (58) | (27) |
| Investment Income | 1,040 | 414 |
| Income Before Provision for Income Taxes and Non controlling Interests | 13,016 | 8,333 |
| Provision for Income Taxes | (3,036 ) | (2,871 ) |
| Net Income | 9,980 | 5,462 |
| Net Income – Non controlling Interests | (2,115 ) | (1,183) |
| Net Income – Attributable to FONAR | $ 7,865 ================ |
$ 4,279 ================ |
| Net Income Available to Common Stockholders | $ 7,375 ================ |
$ 4,020 ================ |
| Net Income Available to Class A Non-Voting PreferredStockholders | $ 365 ================ |
$ 193 ================ |
| Net Income Available to Class C Common Stockholders | $ 125 ================ |
$ 66 ================ |
| Basic Net Income Per Common Share Available to Common Stockholders | $ 1.14 ================ |
$ 0.62 ================ |
| Diluted Net Income Per Common Share Available to Common Stockholders | $ 1.12 ================ |
$ 0.60 ================ |
| Basic and Diluted Income Per Share – Class C Common | $ 0.33 ================ |
$ 0.17 ================ |
| Weighted Average Basic Shares Outstanding – Common Stockholders | 6,448 ================ |
6,534 ================ |
| Weighted Average Diluted Shares Outstanding - Common Stockholders | 6,576 ================ |
$ 6,662 ================ |
| 383 ================ |
383 ================ |
|
| |
||
| |
||
|
|
||
| FOR THE SIX MONTHS ENDED DECEMBER 31, |
||
| Cash Flows from Operating Activities: | 2023 | 2022 |
| Net income | $ 9,980 | $ 5,462 |
| Adjustments to reconcile net income to net cash provided by operating activities: | ||
| Depreciation and amortization | 2,415 | 2,218 |
| Amortization on right-of-use assets | 2,146 | 2,238 |
| Provision for bad debts | 355 | 2,891 |
| Deferred income tax – net | 2,284 | 2,306 |
| Gain on sale of equipment – related party | (577 ) | — |
| (Increase) decrease in operating assets, net: | ||
| Accounts, medical and management fee receivable(s) | (4,958 ) | (3,375 ) |
| Notes receivable | 50 | 11 |
| Inventories | (265) | (274) |
| Prepaid expenses and other current assets | 217 | 60 |
| Other assets | 22 | — |
| Increase (decrease) in operating liabilities, net: | ||
| Accounts payable | (244 ) | (685 ) |
| Other current liabilities | (2,341 ) | (3,228 ) |
| Operating lease liabilities | (2,265 ) | (1,874 ) |
| Financing lease liabilities | (108 ) | (126 ) |
| Customer deposits | (3 ) | 271 |
| Other liabilities | (19 ) | (33 ) |
| Net cash provided by operating activities | 6,689 | 5,862 |
| Cash Flows from Investing Activities: | ||
| Purchases of property and equipment | (192 ) | (1,362 ) |
| Cost of patents | (20) | (74) |
| Net cash used in investing activities | (212 ) | (1,436 ) |
| Cash Flows from Financing Activities: | ||
| Repayment of borrowings and capital lease obligations | (21) | (15) |
| Purchase of treasury stock | (1,885 ) | (478 ) |
| Distributions to non controlling interests | (2,626 ) | (3,151 ) |
| Net cash used in financing activities | (4,532) | (3,644) |
| Net Increase in Cash and Cash Equivalents | 1,945 | 782 |
| Cash and Cash Equivalents - Beginning of Period | 51,280 | 48,723 |
| Cash and Cash Equivalents - End of Period | $ 53,225 ================ |
$ 49,505 ================ |