FONAR ANNOUNCES 3RD QUARTER FISCAL 2011 FINANCIAL RESULTS
Net Income Surpasses $1 Million for 2nd Straight Quarter
MELVILLE,
NEW YORK, May 10, 2011 - FONAR Corporation (NASDAQ-FONR), today announced its earnings for the third quarter of fiscal 2011, ended March 31, 2011. The Company has net income for the past four quarters and net income from operations for the past five quarters.
Statement of Operations Items
For the quarter ended March 31, 2011, net income was $1.2 million and income from operations was $1.4 million. This is compared to the same period ended March 31, 2010, when the net loss was $8,000 and income from operations was $25,000.
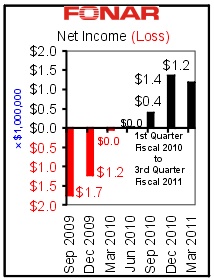 For the nine months ended March 31, 2011, net income was $2.9 million as compared to a loss of $3.0 million for the nine-month period ended March 31, 2010. For the nine months ended March 31, 2011, net income was $2.9 million as compared to a loss of $3.0 million for the nine-month period ended March 31, 2010.
Total revenues increased 15% to $8.7 million for the three-month period ended March 31, 2011, from $7.5 million for the corresponding quarter which ended one year earlier on March 31, 2010. Total revenues for the nine months ended March 31, 2011 were $25.4 million, as compared to the nine months ended March 31, 2011, one year earlier, when net revenues were $23.2 million.
Total operating costs and expenses decreased 3% from $7.5 million for the quarter ended March 31, 2010 to $7.3 million for the quarter ended March 31, 2011.
Revenues from product sales were $1.9 million for the fiscal quarter ended March 31, 2011 as compared to $2.0 million for the corresponding quarter ended March 31, 2010. Revenues from service and repair fees were $2.8 million for the fiscal quarter ended March 31, 2011 and the fiscal quarter ended March 31, 2010. FONAR’s principal product is the UPRIGHT® Multi-Position™ MRI
Significantly, revenues from the management and other fees segment (management of the ten FONAR UPRIGHT® Multi-Position™ MRI diagnostic imaging centers segment) increased 46% from $2.7 million for the three months ended March 31, 2010, to $4.0 million for the three-month period ended March 31, 2011.
Balance Sheet Items
As of March 31, 2011 total current assets were $17.0 million, total assets were $26.4 million, total current liabilities were $24.3 million, and total long-term liabilities were $2.8 million.
As of March 31, 2011, total cash and cash equivalents and marketable securities were $2.4 million as compared to $1.3 million as of June 30, 2010.
As of March 31, 2011, the total stockholder’s deficiency was $781,000 as compared to a total stockholder’s deficiency of $5.8 million as of June 30, 2010, an improvement of $5.0 million.
NASDAQ Continued Listing
On October 14, 2010, the Company received a notice of non-compliance from The NASDAQ Stock Market, LLC, based upon NASDAQ Marketplace Listing Rule 5550(b)(1) which requires a minimum stockholders’ equity requirement of $2.5 million for continued listing on The NASDAQ Capital Market. A hearing was held on March 17, 2011, and subsequently the NASDAQ Hearings Panel granted the Company an extension until May 11, 2011 to complete a newly proposed financing and regain compliance with the stockholders’ equity requirement of $2.5 million.
The Company commenced a private placement of equity and succeeded in raising $6 million by May 2, 2011, which amount was more than sufficient to eliminate the stockholders’ deficiency of $781,000 as of March 31, 2011 and achieve compliance with the stockholders’ equity requirement of $2.5 million.
Significant Highlight
As of March 31, 2011, FONAR has now installed 150 FONAR UPRIGHT® Multi-Position™ MRIs. The 150th was installed in Hamburg, Germany during the recent quarter. It is the fourth UPRIGHT® MRI installed in Germany by Medserena, AG. At the time of the sale, Matthias Schulz, CEO of Medserena, said, “The first three UPRIGHT® Multi-Position™ MRI centers have had great success. With physicians all over Germany asking about this technology, it has become imperative for us to expand and install a fourth FONAR UPRIGHT® MRI scanner. This, is in spite of an intensely active MRI market in Germany, where there are already many conventional lie-down MRIs installed.
“The large number of requests coming from our physicians in Germany,” said Mr. Schulz, “are arising because of the special medical need for FONAR’s unique technology. “The German people tend to recognize the potential of any new technology quickly. We have been very successful in Germany with the FONAR UPRIGHT® MRI and its power for scanning patients in multiple UPRIGHT® and recumbent positions because our physicians have quickly appreciated the benefits of this new technology and want their patients to have access to those benefits as soon as possible.
“With 50% of MRIs being of the spine, it is self-evident that to make a satisfactory imaging diagnosis of the spine, the spine needs to be supporting its normal weight load which the conventional lie-down MRI does not permit. We firmly believe that the FONAR UPRIGHT® Multi-Position™ MRI will become a standard for MRI diagnostics in Europe, especially in evaluating the spine.”
Management Commentary
“We are proud that we have now accomplished one year of solid profitability,” said Raymond Damadian, M. D., president and chairman of FONAR Corporation. “Our total net income for these last four quarters was approximately $3 million and is among the most profitable one year periods in the Company’s history.”
“At this time, all of the segments of our business are strong. Significantly, the management of the ten UPRIGHT® Multi-Position™ MRI centers has given us steady profitability that we can rely on regardless of the state of our economy. A major reason for our profitability has been the cost-control measures that we have taken and which continue to yield results. We are pleased with our accomplishments and plan to continue capitalizing on building a strong business and increasing shareholder value,” said Dr. Damadian.
About FONAR
FONAR was incorporated in 1978, making it the first, oldest and most experienced MRI company in the industry. FONAR introduced the world’s first commercial MRI in 1980, and went public in 1981. Since its inception, nearly 300 recumbent-OPEN MRIs and 150 UPRIGHT® Multi-Position™ MRI scanners worldwide have been installed. FONAR’s stellar product line includes the Upright™ MRI (also known as the Stand-Up™ MRI), the only whole-body MRI that performs Position™ imaging (pMRI™) and scans patients in numerous weight-bearing positions, i.e. standing, sitting, in flexion and extension, as well as the conventional lie-down position. The FONAR UPRIGHT® MRI often sees the patient’s problem that other scanners cannot because they are lie-down only. The patient-friendly UPRIGHT® MRI has a near zero claustrophobic rejection rate by patients. As a FONAR customer states, “If the patient is claustrophobic in this scanner, they’ll
be claustrophobic in my parking lot.” Approximately 85% of patients are scanned sitting while they watch a 42” flat screen TV. FONAR is headquartered on Long Island, New York.
#
For investor and other information visit: www.fonar.com
UPRIGHT® and STAND-UP® are registered trademarks and The Inventor of MR Scanning™, Multi-Position™, pMRI™, Dynamic™, Full Range of Motion™, True Flow™, The Proof is in the Picture™, Spondylography™, Spondylometry™ Landscape™, CSP™ and Upright Radiology™ are trademarks of FONAR Corporation.
This release may include forward-looking statements from the company that may or may not materialize. Additional information on factors that could potentially affect the company’s financial results may be found in the company’s filings with the Securities and Exchange Commission.
###
FONAR CORPORATION AND SUBSIDIARIES
CONDENSED CONSOLIDATED BALANCE SHEETS
(000's OMITTED)
------
|
| ASSETS
|
March 31,
2011
(UNAUDITED)
------------
|
June 30,
2010
------------ |
Current Assets: |
|
|
Cash and cash equivalents
|
$ 2,354 |
$ 1,299 |
Marketable securities
|
33 |
28 |
Accounts receivable - net |
6,577 |
4,821 |
Accounts receivable - related parties - net |
30 |
- |
Medical receivables – net
|
2 |
25 |
Management fee receivable – net
|
3,033 |
2,569 |
Management fee receivable - related medical practices - net
|
1,755 |
1,922 |
Costs and estimated earnings in excess of billings on uncompleted contracts
|
601 |
277 |
Inventories
|
2,192 |
2,826 |
Advances and notes to related medical practices - net
|
- |
83 |
Current portion of notes receivable |
190 |
272
|
Prepaid expenses and other current assets
|
246
------- |
553
------- |
Total Current Assets
|
17,013
------- |
14,675
------- |
Property and equipment - net |
4,034 |
2,109 |
| Notes receivable - net |
229 |
- |
| Management agreement - net |
504 |
- |
Other intangible assets - net |
4,009 |
4,291
|
Other assets
|
565
----------------
|
554
----------------
|
Total Assets
|
$ 26,354
=========== |
$ 21,629
=========== |
FONAR CORPORATION AND SUBSIDIARIES
CONDENSED CONSOLIDATED BALANCE SHEETS
(000's OMITTED)
|
LIABILITIES AND STOCKHOLDERS' DEFICIENCY
|
March 31,
2011
(UNAUDITED)
------------ |
June 30,
2010
------------ |
Current Liabilities: |
|
|
Current portion of long-term debt and capital leases
|
$ 2,148 |
$ 579 |
Current portion of long-term debt – related party |
- |
88 |
Accounts payable |
2,356 |
3,192 |
Other current liabilities |
8,151 |
8,065 |
Unearned revenue on service contracts |
6,748 |
5,220 |
Unearned revenue on service contracts - related parties |
27 |
- |
Customer advances
|
4,693 |
4,813
|
Billings in excess of costs and estimated earnings on uncompleted contracts
|
188
------- |
2,743
------- |
Total Current Liabilities
|
24,311 |
24,700
|
Long-Term Liabilities: |
|
|
|
115 |
63 |
Due to related medical practices
|
230 |
528 |
Long-term debt and capital leases, less current portion
|
1,982 |
1,567 |
Long-term debt, less current portion - related party
|
- |
72 |
Other liabilities |
497
---------------- |
475
---------------- |
Total Long-Term Liabilities
|
2,824
---------------- |
2,705
---------------- |
Total Liabilities
|
27,135
----------------
|
27,405
----------------
|
FONAR CORPORATION AND SUBSIDIARIES
CONDENSED CONSOLIDATED BALANCE SHEETS
(000's OMITTED, except share data)
|
| LIABILITIES AND STOCKHOLDERS' DEFICIENCY (continued) | March 31,
2011
(UNAUDITED)
------------ |
June 30,
2010
------------ |
Class A non-voting preferred stock $.0001 par value;
453,000 and 1,600,000 shares authorized at March 31, 2011 and June 30, 2010, respectively; 313,451 issued and outstanding at March 31, 2011 and June 30, 2010
|
- |
- |
Preferred stock $.001 par value; 567,000 and 2,000,000 shares authorized at March 31, 2011 and June 30, 2010, respectively; issued and outstanding - none
|
- |
- |
Common Stock $.0001 par value; 8,500,000 and 30,000,000 shares authorized at March 31, 2011 and June 30, 2010,respectively; 5,480,958 and 4,985,850 issued at March 31, 2011 and June 30, 2010, respectively; 5,469,315 and 4,974,207 outstanding at March 31, 2011 and June 30, 2010, respectively
|
1 |
1 |
Class B Common Stock $ .0001 par value; 227,000 and
800,000 shares authorized at March 31, 2011 and
June 30, 2010, respectively; (10 votes per share), 158 issued and outstanding at March 31, 2011 and June 30, 2010
|
- |
- |
Class C Common Stock $.0001 par value; 567,000 and 2,000,000 shares authorized at March 31, 2011 and June 30, 2010, respectively; (25 votes per share), 382,513 issued and outstanding at March 31, 2011 and June 30, 2010
|
- |
- |
Paid-in capital in excess of par value
|
173,122 |
172,379 |
Accumulated other comprehensive loss |
( 15) |
( 19) |
Accumulated deficit |
(174,339) |
(177,271) |
Notes receivable from employee stockholders |
(117) |
( 191) |
Treasury stock, at cost - 11,643 shares of common stock
at March 31, 2011 and June 30, 2010
|
(675 )
---------------- |
( 675)
---------------- |
Non controlling interests
|
1,242 |
- |
Total Stockholders' Deficiency
|
(781)
---------------- |
( 5,776)
---------------- |
Total Liabilities and Stockholders' Deficiency
|
$ 26,354
=========== |
$ 21,629
=========== |
FONAR CORPORATION AND SUBSIDIARIES
CONDENSED CONSOLIDATED STATEMENTS OF OPERATIONS (UNAUDITED)
(000's OMITTED, except per share data)
|
| |
FOR THE THREE MONTHS ENDED
MARCH 31,
---------------------------
|
| |
2011
----------------
| 2010
---------------- |
REVENUES
Product sales - net
|
$1,855 |
$ 1,955 |
Service and repair fees - net
|
2,769 |
2,778 |
Service and repair fees - related parties - net
|
55 |
55 |
Management and other fees - net
|
2,726 |
1,738 |
Management and other fees - related medical practices - net
|
1,249 |
988 |
|
8,654
---------------- |
7,514
---------------- |
COSTS AND EXPENSES
Costs related to product sales
|
1,392 |
1,353 |
Costs related to service and repair fees
|
792 |
566 |
Costs related to service and repair fees - related parties
|
16 |
11 |
Costs related to management and other fees
|
1,768 |
1,338 |
Costs related to management and other fees - related medical practices
|
616 |
703 |
|
453 |
528 |
Selling, general and administrative
|
2,064 |
2,708 |
|
175
---------------- |
282
---------------- |
|
7,276
---------------- |
7,489
---------------- |
Income from Operations |
1,378 |
25 |
Interest Expense |
(128) |
(66) |
Interest Expense – Related Parties |
- |
(21) |
Investment Income |
64 |
51 |
Interest Income - Related Party |
- |
2 |
Other (Expense) Income |
(61)
---------------- |
1
---------------- |
| Income (Loss) Before Non Controlling Interests |
1,253 |
(8) |
| Net Income - Non Controlling Interests |
(69)
---------------- |
-
---------------- |
NET INCOME (LOSS) - Controlling Interests |
$ 1,184
=========== |
$ (8)
=========== |
Net Income (Loss) Available to Common Stockholders |
$ 1,099 $
===========
|
(8)
===========
|
Net Income Available to Class C Common Stockholders
|
$ 21
=========== |
$ N/A
=========== |
| Basic Net Income (Loss) Per Common Share |
$ 0.21
===========
|
$ (0.00)
===========
|
Diluted Net Income (Loss) Per Common Share
|
$ 0.20
=========== |
$ (0.00)
=========== |
| Basic and Diluted Income Per Share-Common C |
$ 0.05
=========== |
N/A
=========== |
| Weighted Average Basic Shares Outstanding |
5,345,349
=========== |
4,929,752
=========== |
| Weighted Average Diluted Shares Outstanding |
5,472,853
=========== |
4,929,752
=========== |
FONAR CORPORATION AND SUBSIDIARIES
CONDENSED CONSOLIDATED STATEMENTS OF OPERATIONS (UNAUDITED)
(000's OMITTED, except per share data)
|
| |
FOR THE NINE MONTHS ENDED
MARCH 31,
---------------------------
|
| |
2011
----------------
|
2010
----------------
|
REVENUES
Product sales - net
|
$ 6,303 |
$ 6,479 |
Service and repair fees - net
|
8,111 |
8,163 |
Service and repair fees - related parties - net
|
165 |
165 |
Management and other fees - net
|
7,195 |
5,212 |
Management and other fees - related medical practices - net
|
3,584 |
2,613 |
License fees and royalties
|
- |
585 |
|
|
25,358
---------------- |
23,217
---------------- |
COSTS AND EXPENSES
Costs related to product sales
|
5,265 |
5,289 |
Costs related to service and repair fees
|
2,158 |
2,485 |
Costs related to service and repair fees - related parties
|
44 |
50 |
Costs related to management and other fees
|
4,789 |
3,989 |
Costs related to management and other fees - related medical practices
|
1,988 |
2,208 |
|
|
1,060 |
2,159 |
Selling, general and administrative
|
6,192 |
9,042 |
|
|
606
----------------
|
659
----------------
|
|
|
22,102
----------------
|
25,881
----------------
|
Income (Loss) from Operations
|
3,256 |
(2,664) |
Interest Expense
|
(359) |
(235) |
Interest Expense – Related Parties
|
(4) |
(40) |
Investment Income
|
160 |
203 |
Interest Income - Related Party
|
1 |
9 |
Other (Expense) Income
|
(53) |
35 |
| Loss on Note Receivable |
-
---------------- |
(350)
---------------- |
| Net Income (Loss) Before Non Controlling Interests |
3,001 |
(3,042) |
| Net Income - Non Controlling Interests |
(69)
---------------- |
-
---------------- |
NET INCOME (LOSS) - Controlling Interests
|
$ 2,932
===========
|
$ (3,042)
===========
|
Net Income (Loss) Available to Common Stockholders
|
$ 2,720
===========
|
$ (3,042)
===========
|
Net Income Available to Class C Common Stockholders
|
$ 53
===========
|
$ N/A
===========
|
| Basic Net Income (Loss) Per Common Share |
$ 0.53
===========
|
$ (0.62)
===========
|
Diluted Net Income (Loss) Per Common Share
|
$ 0.51
===========
|
$ (0.62)
===========
|
| Basic and Diluted Income Per Share-Common C |
$ 0.14
===========
|
N/A
===========
|
| Weighted Average Basic Shares Outstanding |
5,169,253
===========
|
4,917,990
===========
|
| Weighted Average Diluted Shares Outstanding |
5,296,757
===========
|
4,917,990
===========
|
FONAR™ Corporation
110 Marcus Drive
Melville, N.Y. 11747
Tel. 631-694-2929
Fax. 631-390-9540
Email sales@FONAR.com
Investor Information

Site Map
| Terms of Use-Our
Privacy Policy Use
Copyright © 2011 FONAR- All Rights Reserved |
